
KUBERNETES FUNDAMENTALS
KUBERNETES CLUSTER MONITORING
Part 2
Introduction
In the second part of this two-part blog series, we’ll focus on deploying Prometheus and Grafana. But first, let’s recap: In Part 1, we set up all the essential metrics required for Prometheus to gather information about pods, services, namespaces, and node hardware.
Now, let’s explore how to monitor your Kubernetes cluster by deploying Prometheus and using Grafana dashboards.
MONITORING A KUBERNETES CLUSTER
Step 1: Deploying Prometheus for Kubernetes Monitoring
1. Access the Monitoring Directory:
- Navigate to the “monitoring” directory where all the Prometheus deployment files are located.
2. Create Prometheus Resources:
- Execute the following command:
$ kubectl create -f prometheus
- This action sets up the Prometheus pod, services, and deployment within the “monitoring” Namespace.
3. Access Prometheus Web Interface:
- Use the following syntax in a web browser:
http://<public-ip-of-worker-node>:32300
- You’ll be able to view the Prometheus interface.
Remember to replace
<public-ip-of-worker-node>with the actual public IP address of your worker node.
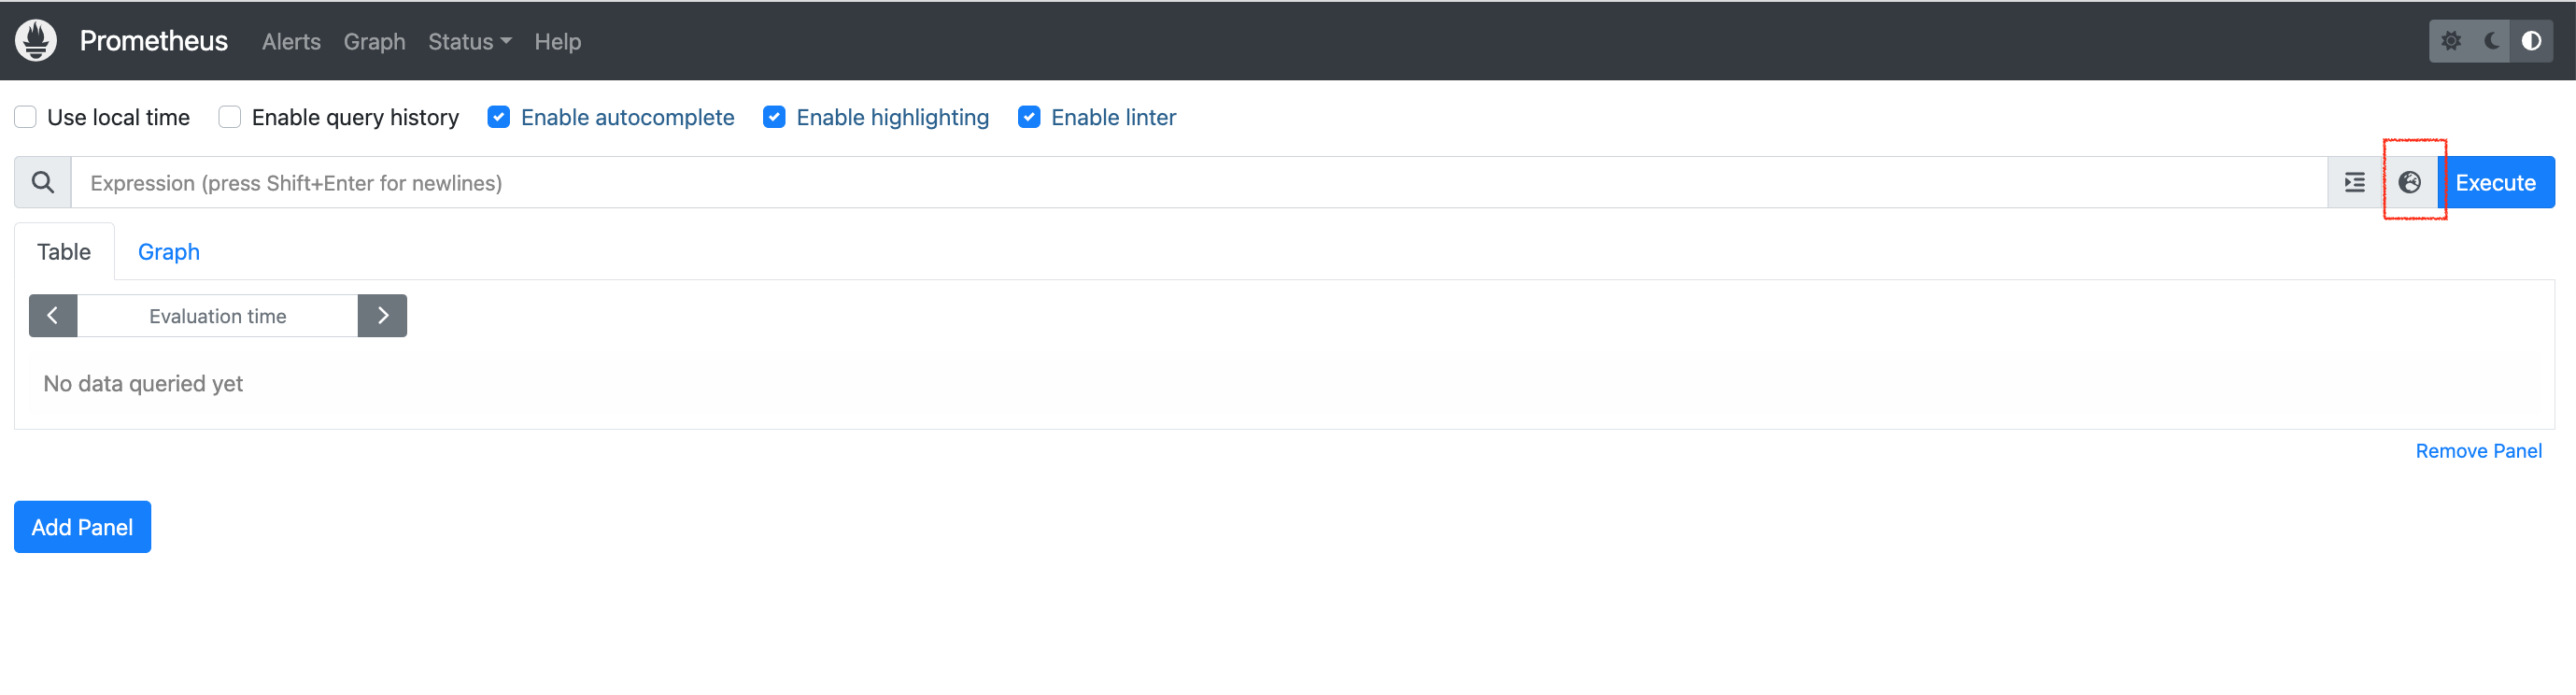
Below is a screenshot of Prometheus in a browser. Click on the box (marked in red), which will give a list of queries that you can execute and see the results.
We have executed a “kube_pod_info” query which gives the below output:
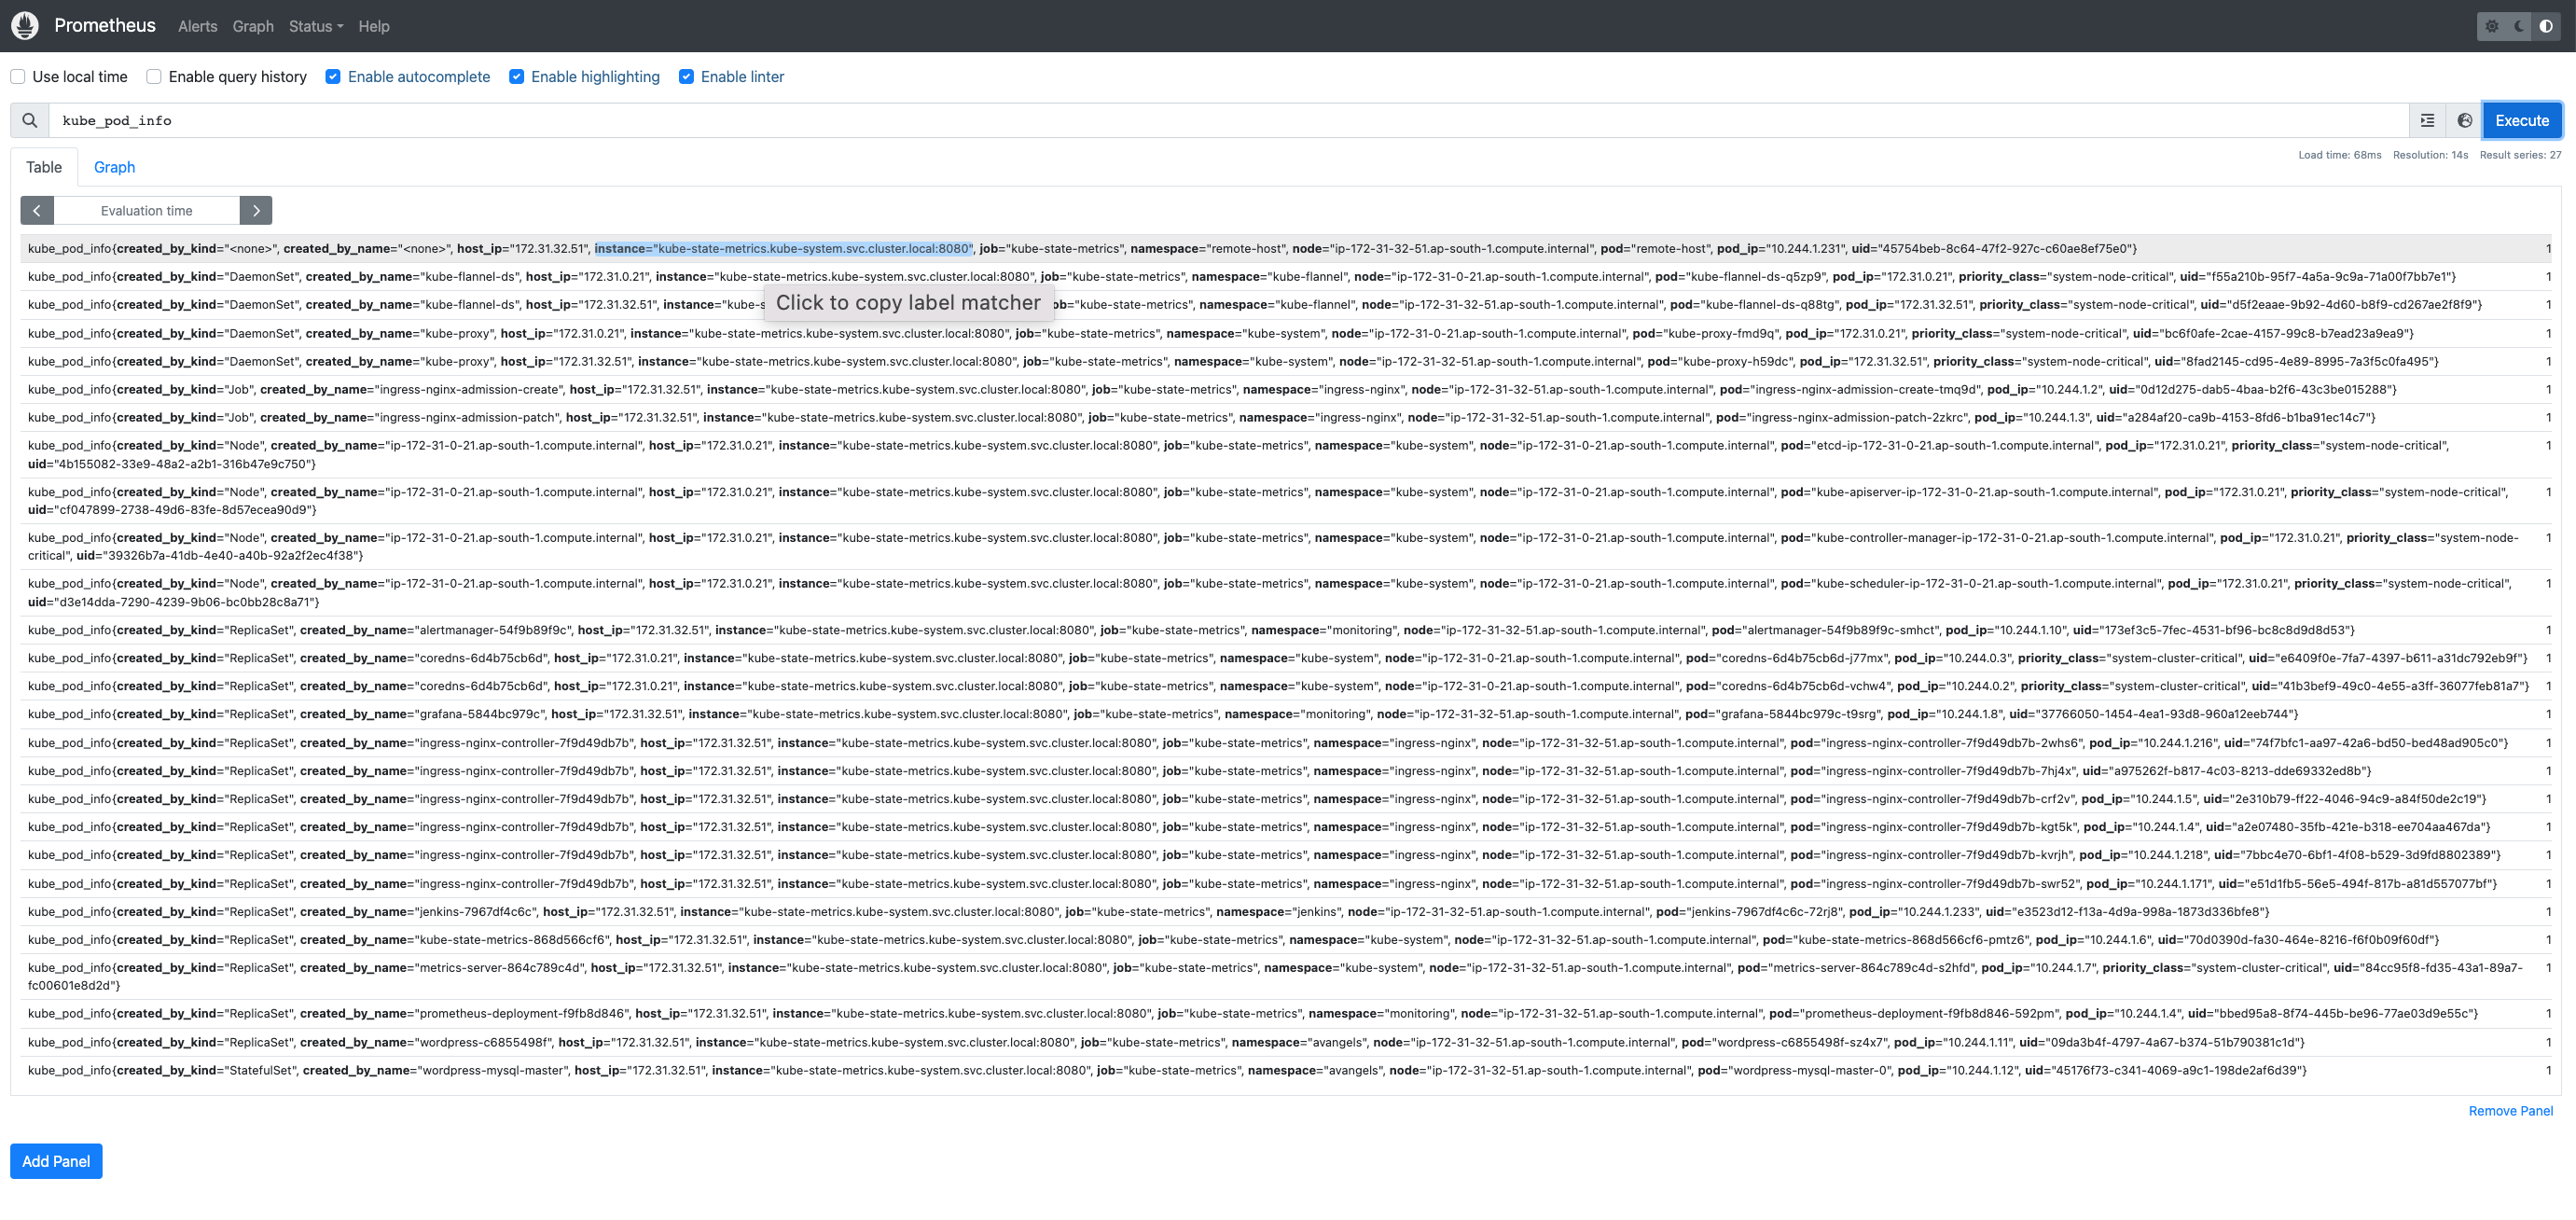
When reviewing the output of Kubernetes queries, it’s evident that the information is presented in a non-graphical format, requiring careful examination to understand the deployment status and identify any potential issues with pods or deployments.
Enter Grafana! Grafana offers an intuitive dashboard interface that transforms raw metrics data into visual representations. With Grafana, you can monitor the health and performance of your Kubernetes cluster through charts, graphs, and other visual elements. It simplifies the process of identifying trends, anomalies, and bottlenecks, making it an essential tool for efficient cluster management.
Step2: Deploying Grafana for Kubernetes Monitoring
In this step, we’ll deploy Grafana to enhance our Kubernetes monitoring capabilities. Follow these instructions:
1. Deployment Files:
- Locate the Grafana deployment files in the “monitoring” directory.
- Execute the following command to create Grafana resources:
kubectl create -f grafana/
- This command sets up Grafana pods, services, and deployments within the “monitoring” namespace.
2. Verify Grafana Deployment:
- Query the “monitoring” namespace to check Grafana’s status:
kubectl get all -n monitoring
- You should see output similar to the following:
NAME                                      READY   STATUS    RESTARTS   AGE
pod/alertmanager-54f9b89f9c-smhct         1/1     Running   0          28h
pod/grafana-5844bc979c-t9srg              1/1     Running   0          2d1h
pod/prometheus-deployment-f9fb8d846-592pm 1/1     Running   0          2d1h

NAME                                      TYPE      CLUSTER-IP       EXTERNAL-IP   PORT(S)           AGE
service/alertmanager                      NodePort  10.96.109.24      <none>        9093:31000/TCP    28h
service/grafana                           NodePort  10.105.161.41    <none>        3000:32500/TCP    2d1h
service/prometheus-service                NodePort  10.107.155.121   <none>        8080:32300/TCP    2d1h

NAME                                      READY   UP-TO-DATE   AVAILABLE   AGE
deployment.apps/alertmanager              1/1     1            1           28h
deployment.apps/grafana                   1/1     1            1           2d1h
deployment.apps/prometheus-deployment     1/1     1            1           2d1h

NAME                                      DESIRED   CURRENT   READY   AGE
replicaset.apps/alertmanager-54f9b89f9c    1         1         1       28h
replicaset.apps/grafana-5844bc979c         1         1         1       2d1h
replicaset.apps/prometheus-deployment-f9fb8d846 1         1         1       2d1h
3. Namespace Check:
- Confirm that Alert Manager, Prometheus, and Grafana are running in the “monitoring” namespace.
- Additionally, check if “kube-metrics” and “metrics-server” are operational in the “kube-system” namespace:
kubectl get all -n kube-system
4. Access Grafana:
- Grafana is exposed on port 32500.
- To access Grafana via a web browser, use the following syntax:
http://<public-ip-of-worker-node>:32500
Below is a screenshot of the Grafana login screen in a browser.
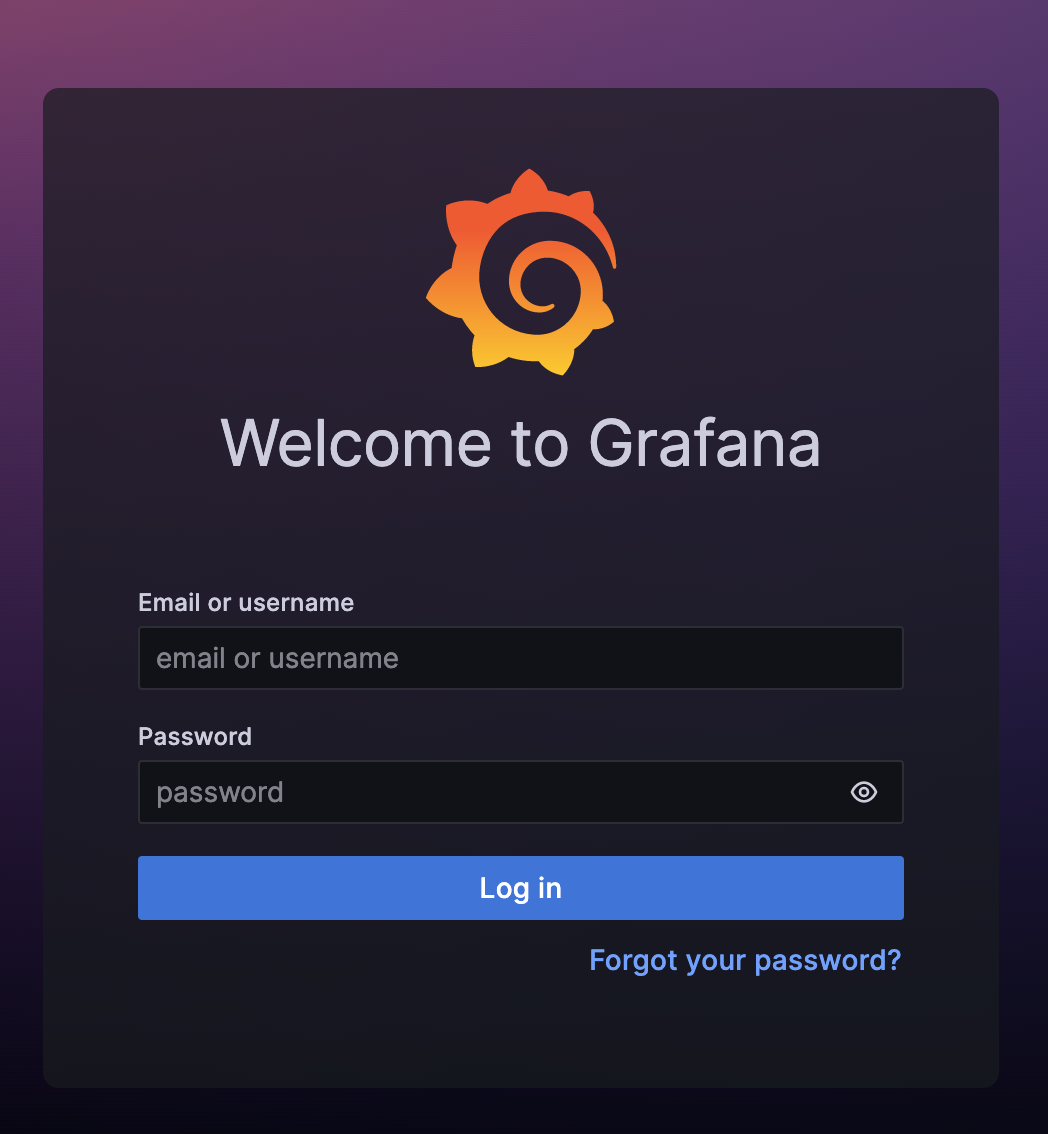
You can use the below credentials for logging in.
Email or username –> admin
Password –> admin
The next screen, asks for setting a new password, you can set a new password or continue with the above password, as shown below:
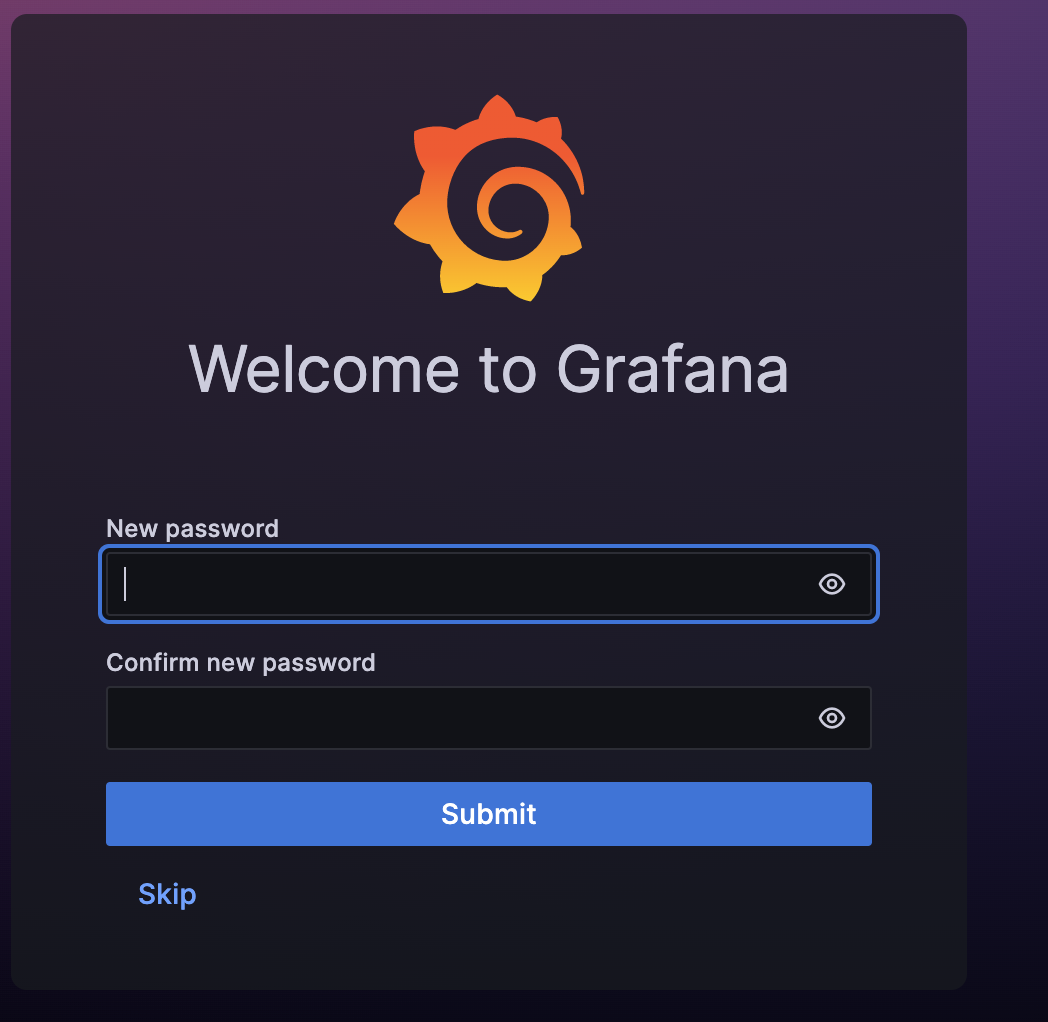
Click –> Submit
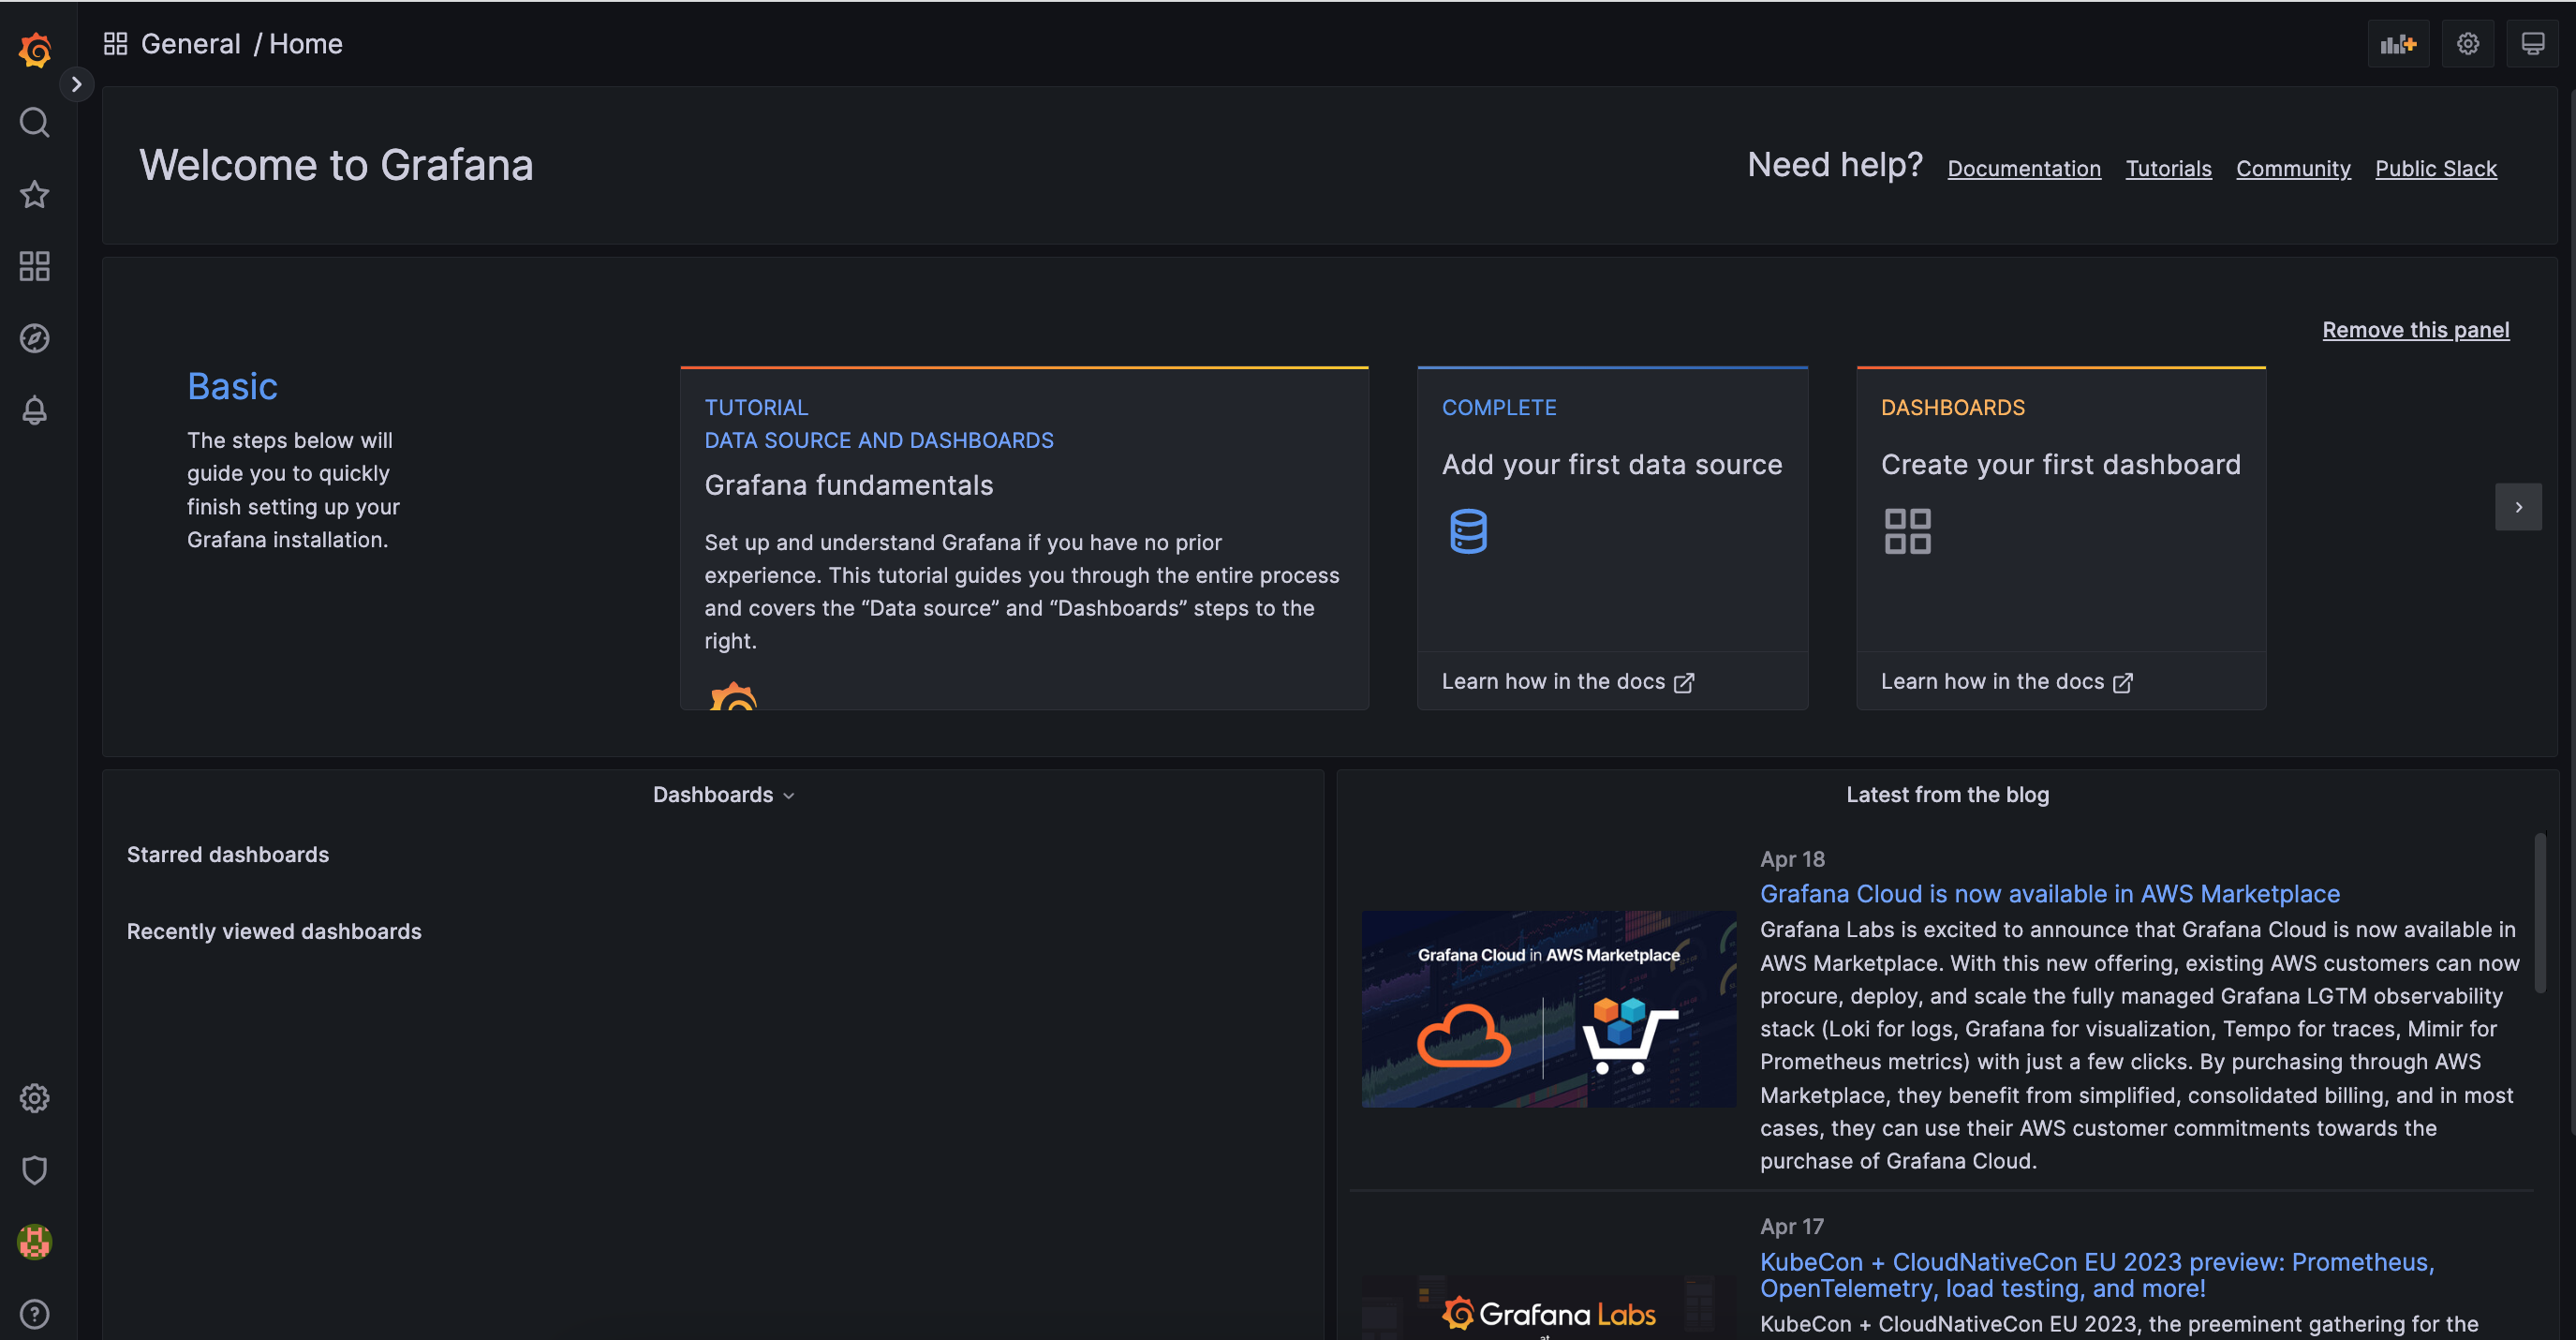
This will bring you to the Grafana Homepage
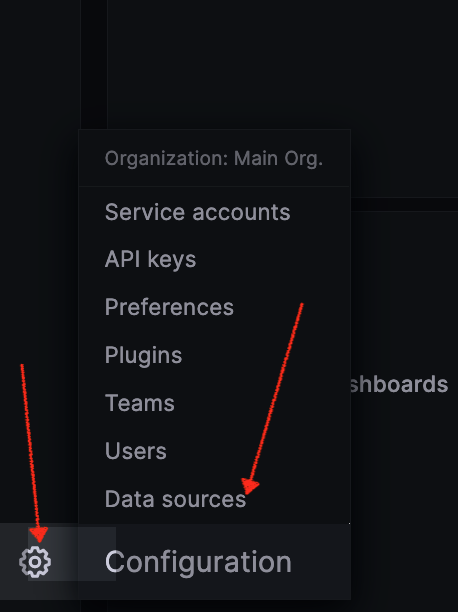
Next, click on the configuration icon below.
Configuration –> Data sources
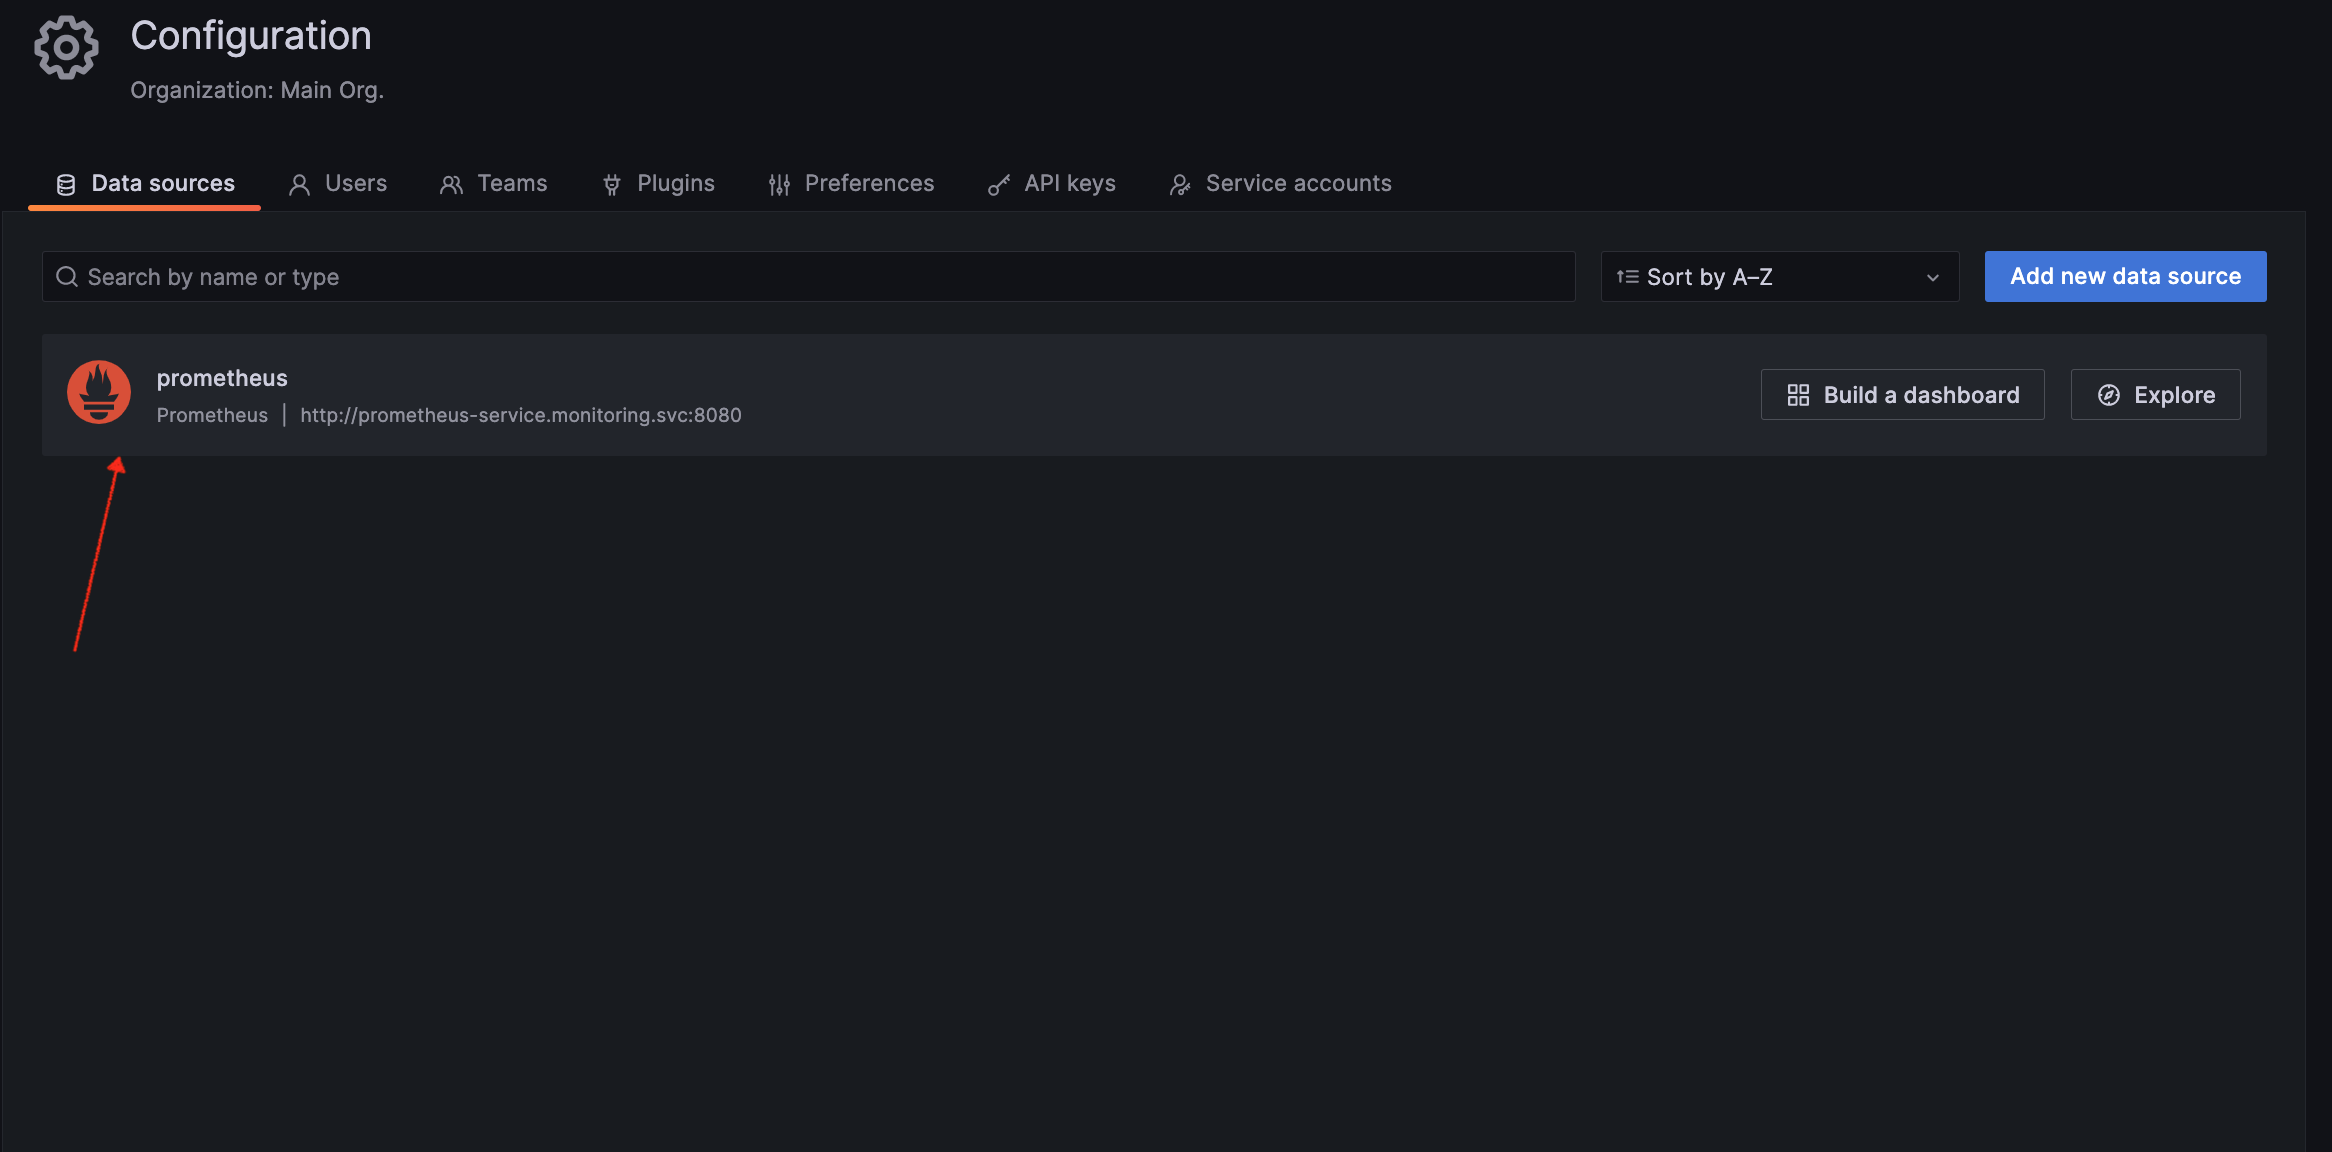
This brings up the configuration screen.
Click the Prometheus –> Data source
Click Save and test
If everything is OK, then you should get the below screen.

Now you can add Dashboards to view your Kubernetes cluster
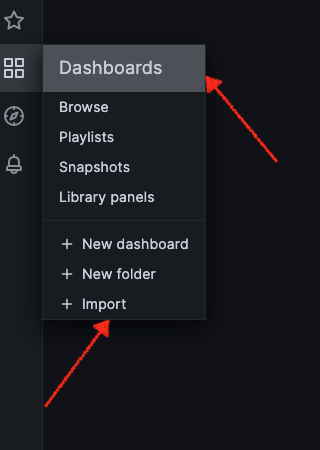
Dashboards –> Import
You can search for Dashboards from the below link:
https://grafana.com/grafana/dashboards/
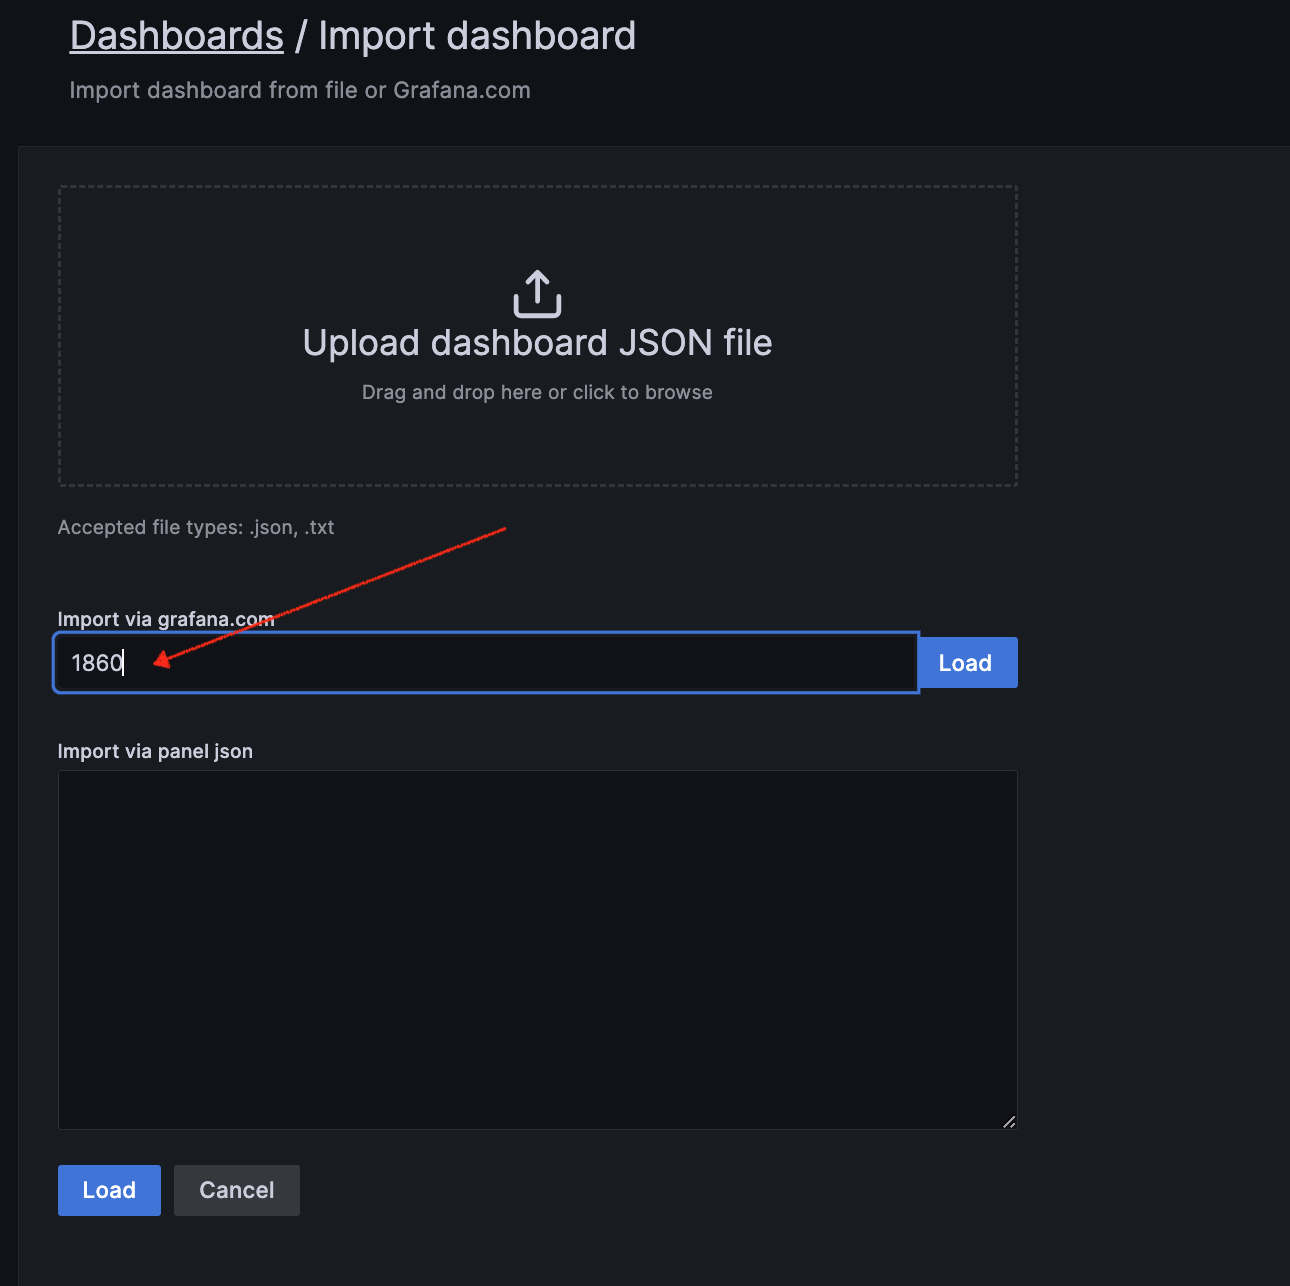
We have selected a Dashboard ID = 1860 from Grafana. Insert this ID and Load
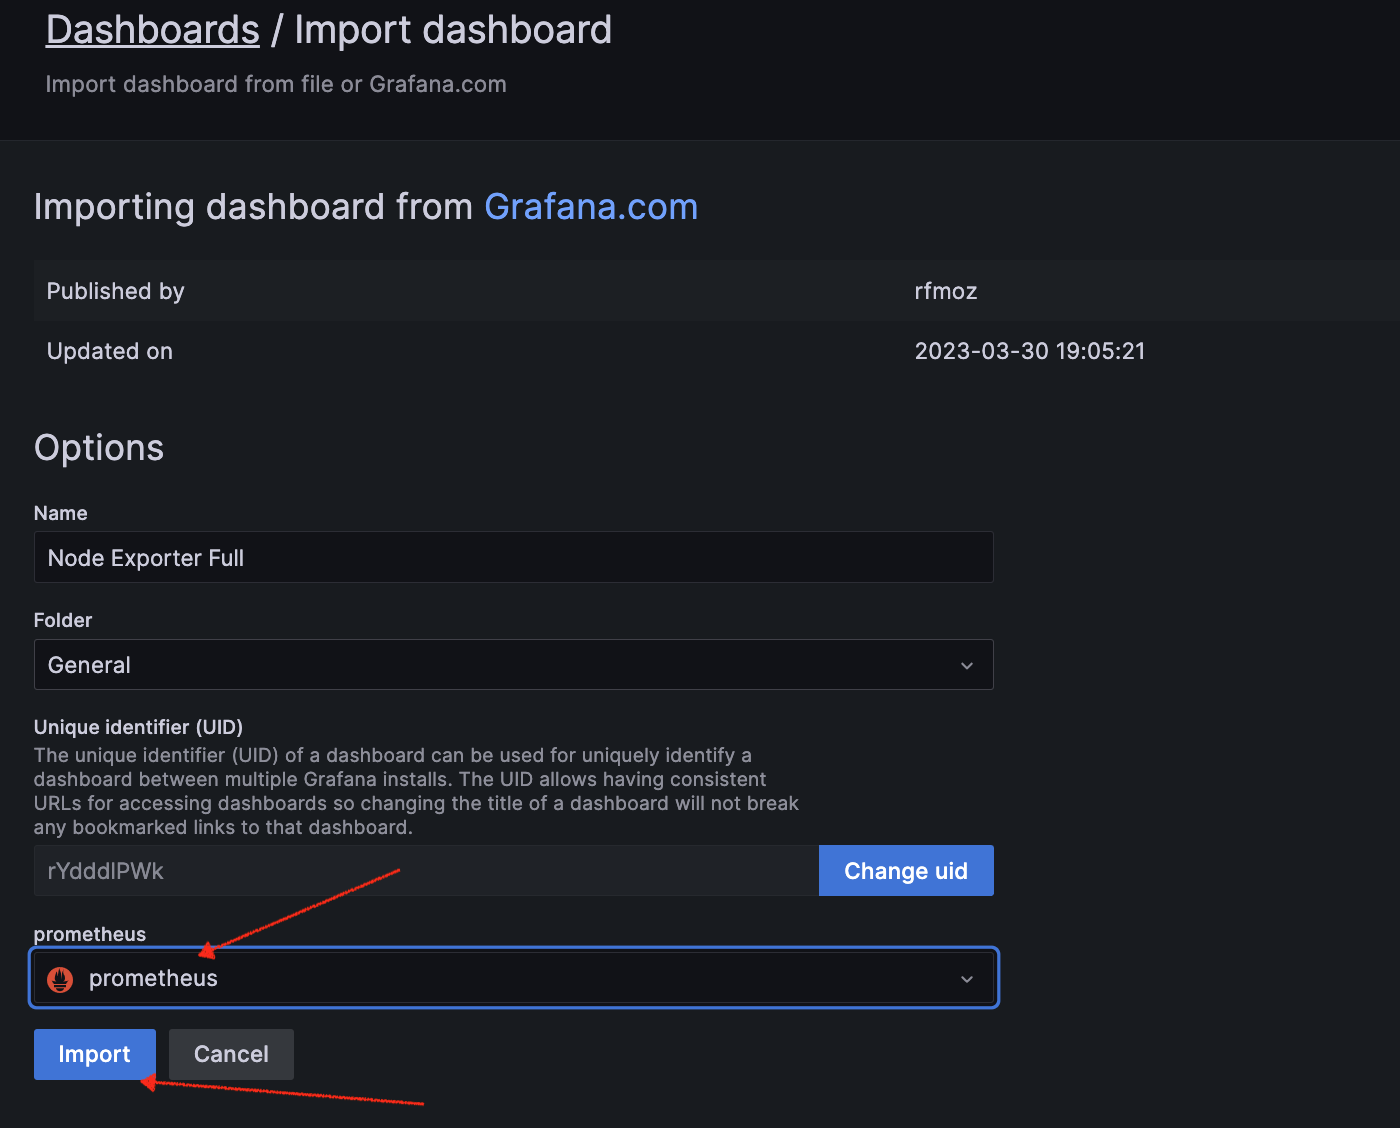
Next, import the Dashboard. Ensure that you select Prometheus as the Data source and click on Import
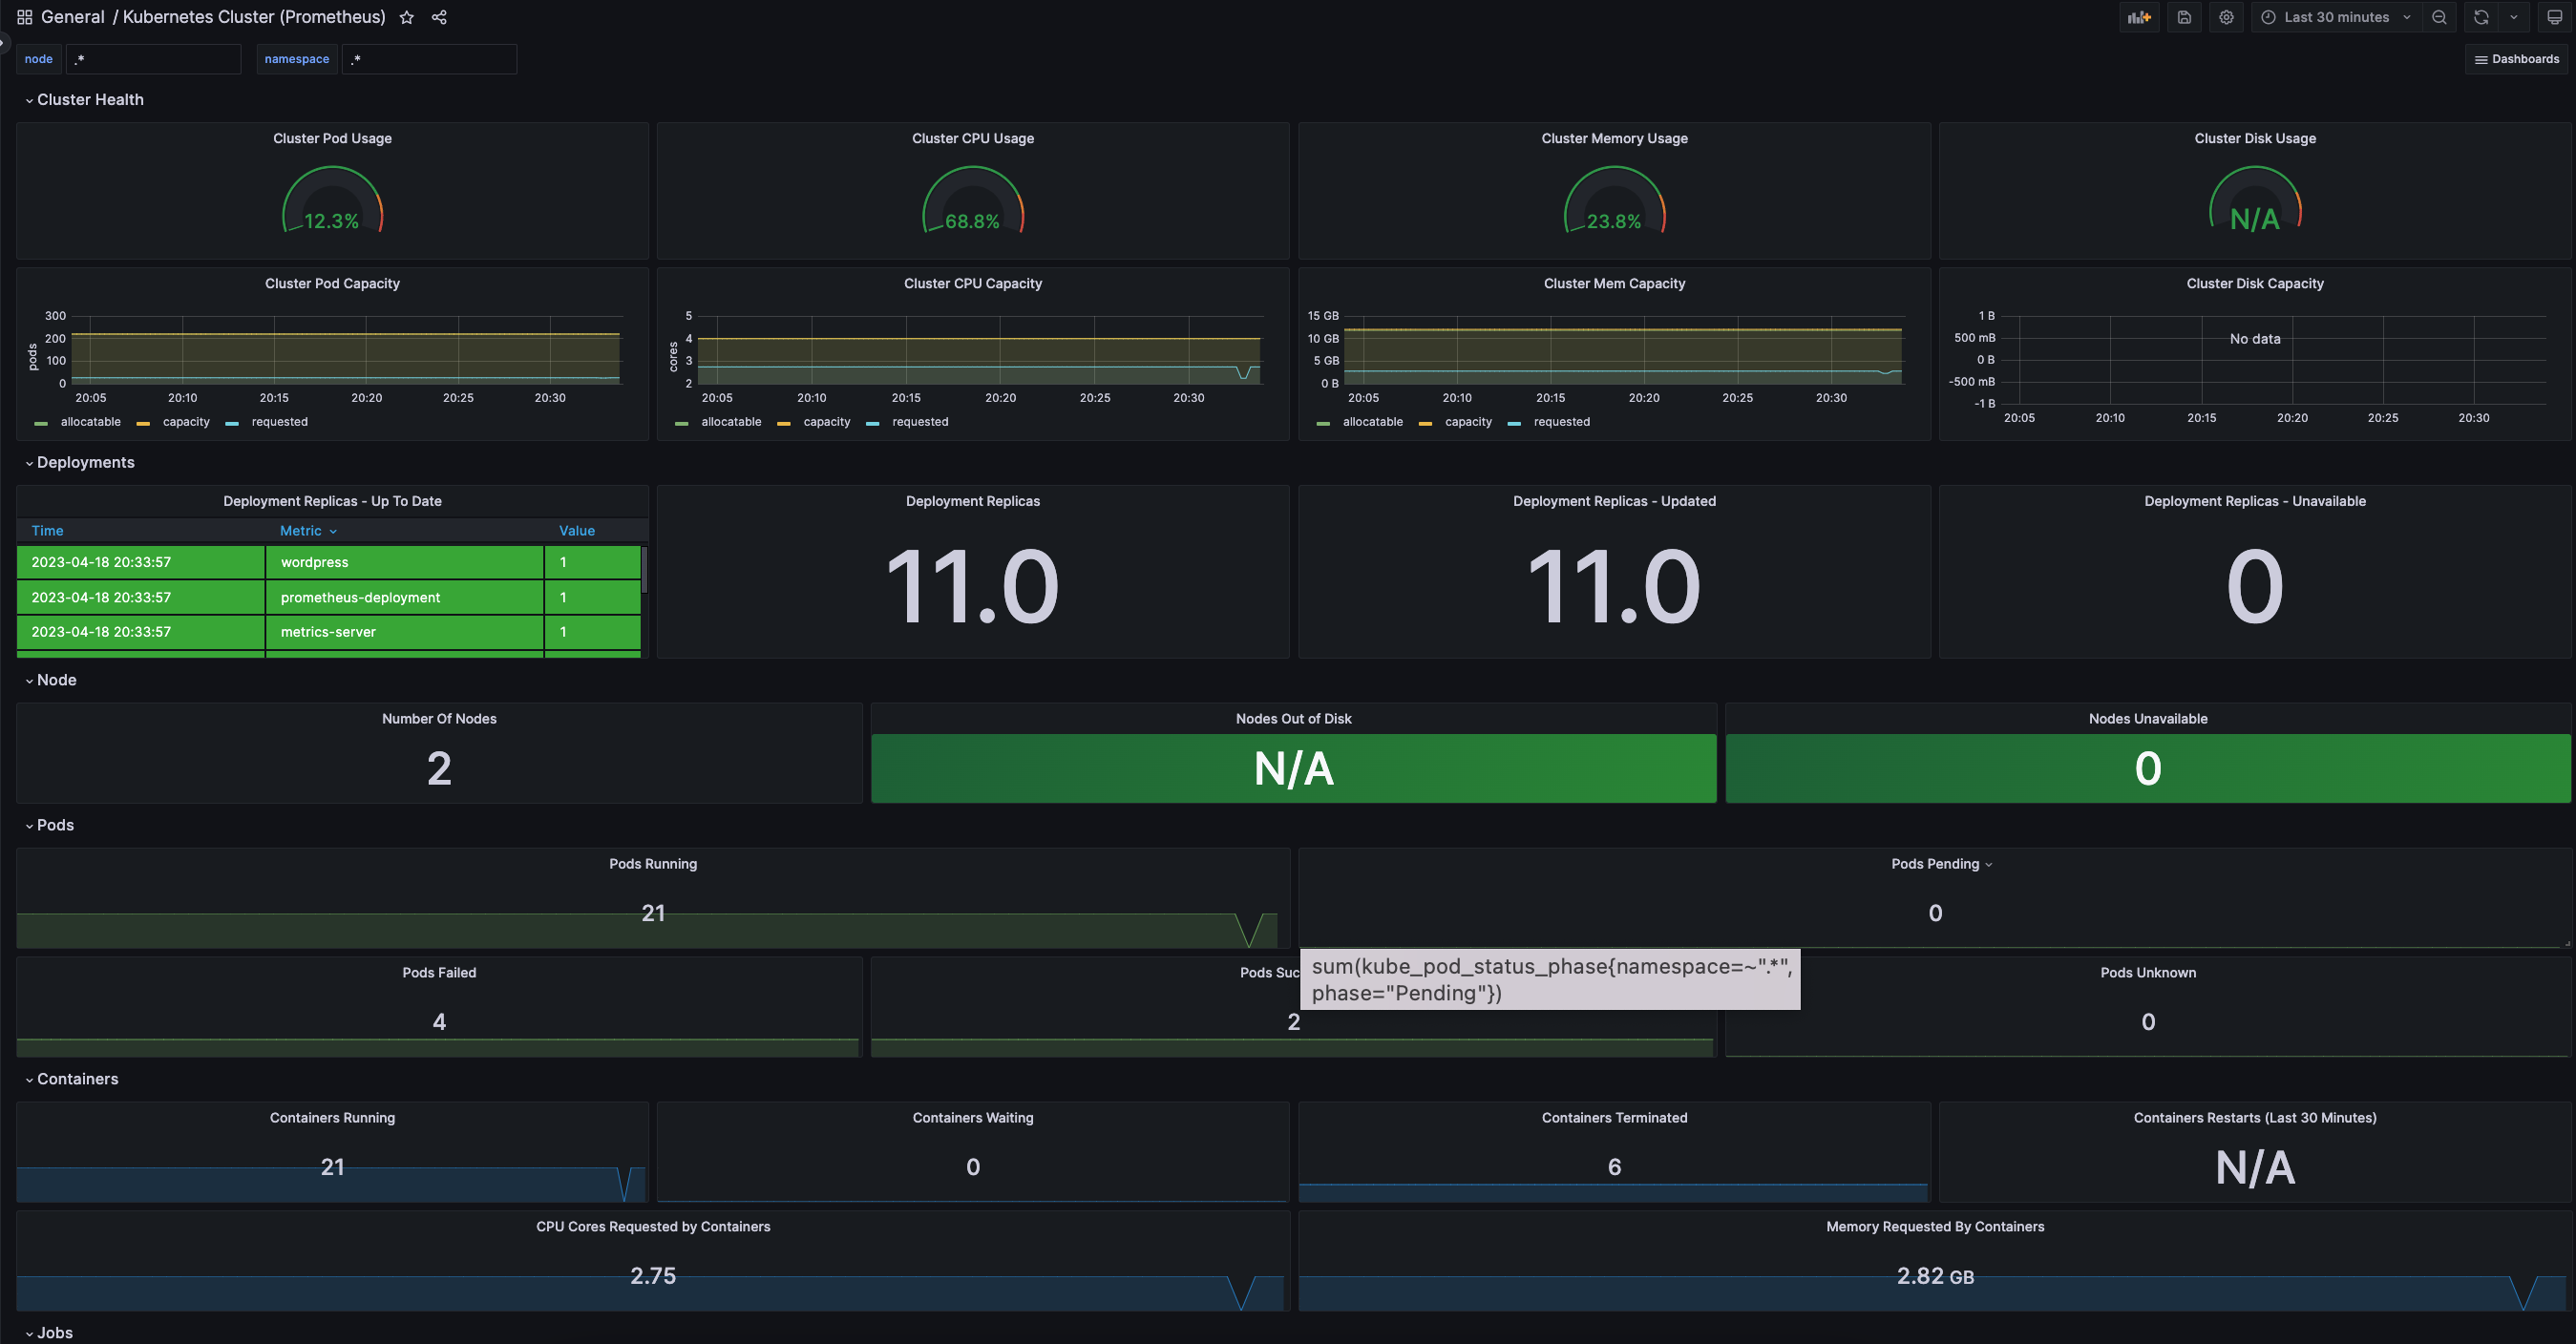
Based on your Dashboard ID and your requirements, import the appropriate dashboard to monitor your Kubernetes cluster. Below is a screenshot of the Grafana dashboard.
Congratulations!
You’ve successfully established monitoring for your Kubernetes cluster by installing metrics, Prometheus, and Grafana.
Feel free to explore the metrics and insights provided by Grafana, and don’t hesitate to reach out if you need further assistance. Well done!
Part 1
Comments are closed.