
Kubernetes Fundamentals
Kubernetes Cluster Monitoring
Part 1
Introduction
In the first part of our two-part blog series, we delve into essential methods for monitoring Kubernetes clusters. In the first part of our deployment process, we set up essential metrics components. Now, in Part 2, we’ll focus on deploying Prometheus and Grafana components.
As Kubernetes administrators, it’s crucial to effectively manage complex app modernization and containerization. By monitoring your Kubernetes clusters, you gain insights into uptime, resource utilization, and interactions among components. Some of the key benefits of Kubernetes monitoring include resource management (keeping track of memory, CPU, and storage usage to optimize resource allocation), issue identification (detecting issues promptly, such as insufficient resources, pod failures, or nodes unable to join the cluster), and visibility (specialized cloud-native monitoring tools provide full visibility into cluster activity).
Kubernetes monitoring empowers cluster administrators and users to oversee the cluster, swiftly identifying issues like resource shortages, pod failures, or nodes unable to join. Organizations often rely on specialized cloud-native monitoring tools for comprehensive visibility into cluster activity.
Essential Metrics for MonitoringKubernetes
Kubernetes Metrics Server aggregates data collected from the kubelet on each node, passing it through the Metrics API, which can then be combined with several visualization tools. Some key metrics to consider tracking include:
- Cluster state metrics, including the health and availability of pods.
- Node status, including readiness, memory, disk or processor overload, and network availability.
- Pod availability, since unavailable pods can indicate configuration issues or poorly designed readiness probes.
- Memory utilization at the pod and node level.
- Disk utilization including lack of space for file system and index nodes.
- CPU utilization in relation to the amount of CPU resource allocated to the pod.
- API request latency is measured in milliseconds, where the lower the number the better the latency.
Kubernetes Monitoring Tools: Enhancing System Health and Performance
Kubernetes, while powerful, introduces complexity. Its ability to distribute containerized applications across data centres and cloud providers necessitates robust monitoring solutions. Let’s explore key open-source tools for Kubernetes monitoring:
1. Prometheus:
- Developed by SoundCloud and donated to CNCF, Prometheus excels at monitoring Kubernetes and Docker.
- Provides actionable metrics and alerts.
- Often paired with Grafana for visualization.
2. Grafana:
- An open-source analytics and metric visualization platform.
- Offers dashboards for Cluster, Node, Pod/Container, and Deployment monitoring.
- Integrates seamlessly with Prometheus.
3. Jaeger:
- A tracing system for complex distributed systems.
- Troubleshoots transactions, addressing issues like latency optimization.
4. Kubernetes Dashboard:
- Web UI add-on for workload health monitoring.
5. Prometheus and Grafana Integration:
- Prometheus, a CNCF standard, stands out among time-series databases.
- Grafana enhances Prometheus with customizable dashboards.
- Grafana’s external visualization complements Prometheus.
- When deploying Prometheus, Grafana is often included by default.
- Detailed Grafana dashboards allow namespace and pod-level monitoring.
6. Deployment Strategy:
- Deploy Prometheus and Grafana together.
- Consider additional metrics collection tools like Alert-manager, Metrics server, and Kube-metrics.
- These tools provide comprehensive insights into your Kubernetes cluster.
Streamlining Kubernetes Monitoring with EFS and Persistent Volumes
In our deployment strategy, we leverage an existing Elastic File System (EFS) for monitoring purposes. Rather than creating new mount points, we utilize the same ones established for mounting WordPress and Jenkins. Our approach involves creating dedicated directories for configuration files and data within the existing EFS setup.
Key Considerations:
- EFS Integration: We assume that an EFS has already been set up, as detailed in the provided blog.
- Reuse of Mount Points: By reusing existing mount points, we maintain consistency and avoid unnecessary complexity.
- Persistent Volumes (PVs): We rely on PVs to manage storage resources for monitoring components.
Prerequisites for Effective Monitoring:
- Ensure that Kubernetes pods are actively running within your cluster.
- Utilize both Master and Worker nodes to monitor hardware resources effectively.
By following these guidelines, we can establish efficient monitoring practices while maximizing the benefits of our existing infrastructure.
Monitoring A Kubernetes cluster
Step1: Setting Up Monitoring Infrastructure for Kubernetes
1. Create Directories on the Master and Worker Nodes:
- Log in to the Master Node as the “jenkins” user.
- Navigate to the home directory:
$ cd /home/jenkins.- Create a directory named “monitoring”:
$ mkdir monitoring.
2. Namespace Configuration:
- We’ll use the “monitoring” Namespace for most of our monitoring deployments.
- Additionally, the default “kube-system” Namespace collects metrics.
- Create a YAML file for the “monitoring” Namespace (e.g.,
monitoring-namespace.yaml).- Define the Namespace:
apiVersion: v1
kind: Namespace
metadata:
  name: monitoring
- Apply the configuration:
$ kubectl create -f monitoring-namespace.yaml.
3. Download Monitoring Files:
- Within the “monitoring” directory, clone the necessary files from the repository:
$ git clone https://github.com/AvangelsTech/monitoring.git .
- This command clones all relevant directories into the current “monitoring” directory.
By following these steps, you’ll establish a solid foundation for monitoring your Kubernetes cluster.
Step 2: Deploying Metrics for Prometheus Monitoring
In this step, we’ll set up the necessary metrics for Prometheus integration. Follow these organized instructions:
1. Navigate to the Monitoring Directory:
- Log in to the Master Node as the “jenkins” user.
- Change to the monitoring directory:
$ cd monitoring.- Confirm that you have the required directories and YAML files.
2. Cloning Monitoring Files:
- We’ve already cloned the GitHub repository containing monitoring files.
- Verify the directory structure:
$ ls -ltr.- You should see subdirectories like
alert-manager,grafana,kube-metrics,metrics-server, andprometheus.drwxrwxr-x. 2 jenkins jenkins 6144 Apr 17 07:00 alert-manager
drwxrwxr-x. 2 jenkins jenkins 6144 Apr 16 10:23 grafana
drwxrwxr-x. 2 jenkins jenkins 6144 Jan7 14:04 kube-metrics
drwxrwxr-x. 2 jenkins jenkins 6144 Jan 10 08:57 metrics-server
drwxrwxr-x. 2 jenkins jenkins 6144 Apr 17 06:00 prometheus
3. Deploy Alert-manager:
- Execute:
$ kubectl create -f alert-manager/.- This command sets up the alert-manager pod, services, and deployment within the “monitoring” Namespace.
- Note: The alert manager is exposed on port 31000.
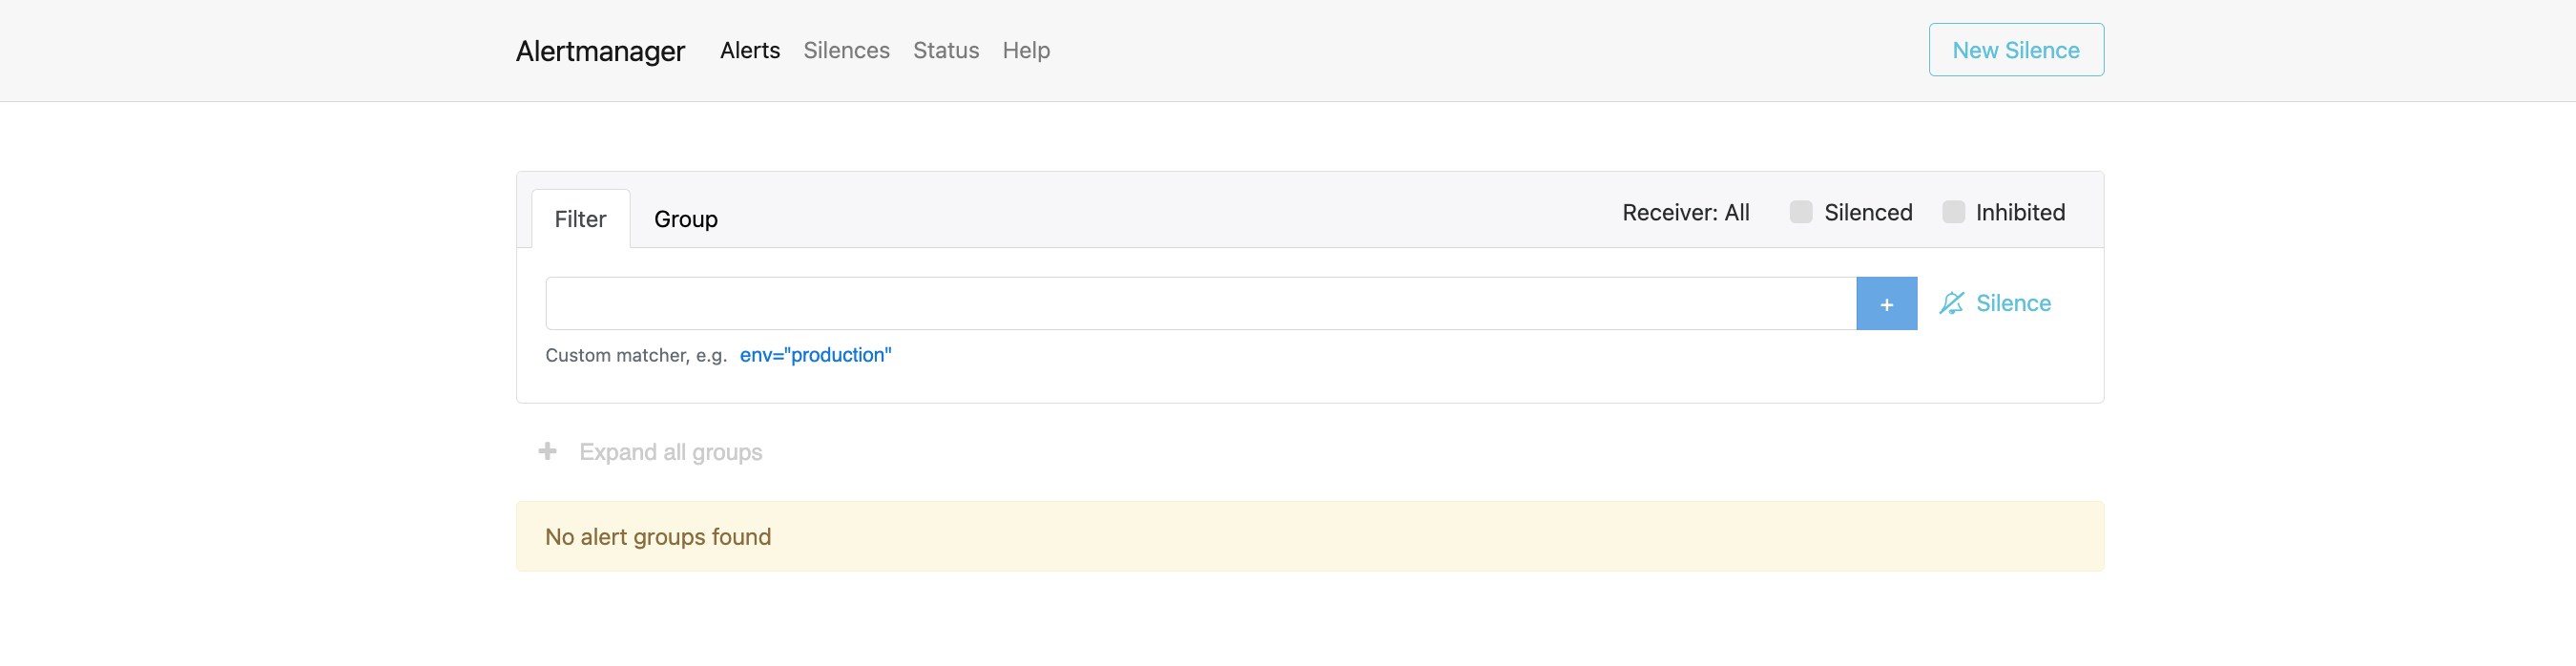
4. Access Alert-manager:
- Use the following syntax in a web browser:
http://<ip-of-worker-node>:31000
- You’ll be able to view the alert-manager interface.
Remember to replace
<ip-of-worker-node>with the actual IP address of your worker node.
Below is a screenshot of the alert-manager in a browser.
Deploying “kube-metrics” and “metrics-server” for Kubernetes Monitoring
1. Deploy “kube-metrics”:
- Execute the following command:
$ kubectl create -f kube-metrics/
- This action sets up the “kube-metrics” pod, services, and deployment within the “kube-system” Namespace.
2. Deploy “metrics-server”:
- Run the command:
$ kubectl create -f metrics-server/
- This creates the “metrics-server” components in the same “kube-system” Namespace.
By following these steps, you’ll have essential monitoring tools in place for your Kubernetes cluster.
This completes the deployment of the necessary metrics components that will be used by Prometheus to monitor the Kubernetes cluster.
Part2
Comments are closed.